Viewing Failure Analysis Data
Failure analysis results can be viewed in a number of ways. The most convenient is the graphical Results dialogs. Three different formats are provided:

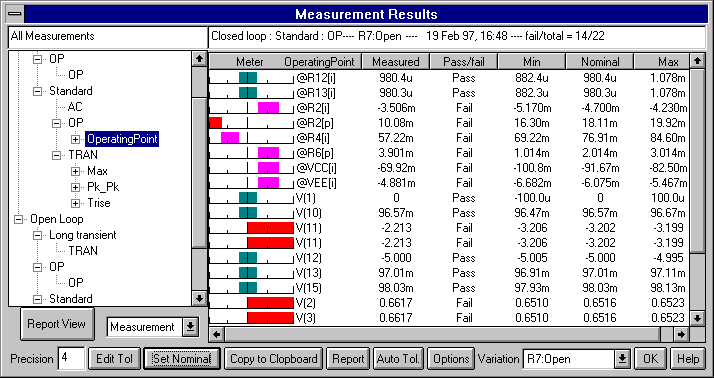
Example Results dialog showing the measured, nominal, max and min values for a single failure mode. You can change the failure mode (Variation field) and watch the measured data. The histogram meter (left side) give a clear indication of whether the measurement passed or how it failed.

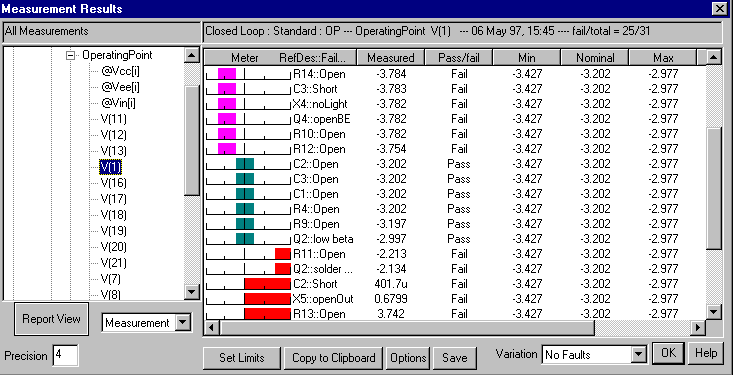
Example Results dialog showing the measured, nominal, max and min values for a single measurement and for all failure modes. You copy the report to the clipboard in order to paste it into your favorite word processing program (Copy to Clipboard button).

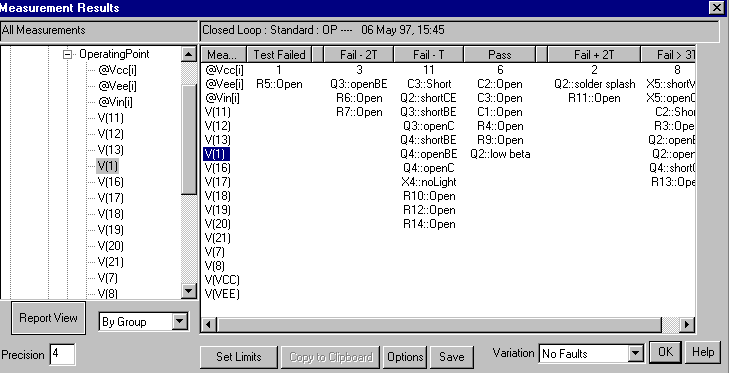
Example Results dialog showing the measured, nominal, max, and min values for a single measurement. The failure modes are shown grouped in various pass-fail “histogram’ bins.