Tesla Coil Project
In this project, you'll learn about resonant circuits and how to build oscillators that zero in on a desired region of the resonance. You will also learn about how to safely handle high-voltage DC circuits and ultra-high voltage radio frequency circuits. You will learn how do describe a circuit's behavior using algebraic equations based on Kirchoffs' current law. Finally, you will use your ICAP/4 simulator to solve these equations.
|
Danger,
High Voltage Hazard: Almost all Tesla Coil circuitry carries
dangerously high voltage. You should turn the AC mains power to
your Tesla Coil circuit off before connecting any instrumentation.
Filter capacitors require bleed resistors that will discharge
the capacitors to a safe level within 1 second after power is
switched off. The person that connects the instrumentation should
be the one that turns the AC power on and off. It is not the time
to learn communication skills! Do not touch any of the circuitry
when power is applied. The resonant circuits place dangerously
high voltages on the primary side of the Tesla Coil as well as
its secondary. While some smaller plasma streamers are harmless,
you don't want to be near or touch the Tesla Coil secondary. When
working with high voltage, some experienced engineers tell you
to keep one hand in your pocket; that makes it harder for you
to become part of the circuit.
|
It has become common around the Christmas holiday to see variations of Tesla Coils in the high-end gadget stores. The high voltage, high frequency emissions interact with air and other gas to make a dazzling array of visual effects. You can build your own Tesla Coil using readily available parts. Construction of Tesla Coils is described in a variety of ways on the Internet. What's in common is a large diameter coil with a very large step-up turns ratio. Nicoli Tesla, who invented the Tesla Coil, used the breakdown of a spark gap to drive the primary. However, modern power electronics give us a much better set of analysis tools and hardware components to couple energy more efficiently into the coil.
Starting
with a 10-inch coil wound on a 3.5 in. diameter form using #30 wire, a
circuit model was constructed.
|
Winding
notes: The secondary was wound on a 3.5in OD PVC pipe, using
4 stripes of 1.5 mil double stick tape to hold the wire in place
as it was wound. End caps were used to support the coil vertically.
The coil was wound by hand with the coil in the vertical position.
The feed wire spool was placed on a CD bobbin that was taped to
a desk so it was free to rotate as we wound the coil
|
Laboratory
measurements were made to find the coil self-inductance and resonant frequency.
An inexpensive LC meter measured the inductance, and a signal generator
was used to excite the coil at its self-resonant frequency as shown in
Figure 1.
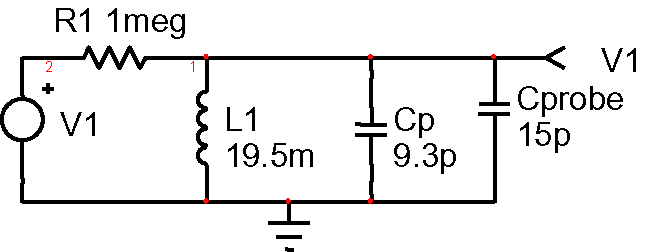
| Figure 1: | Resonance measure at 228.9kHz, loaded with a 15pf scope probe, leaves 9.3p for the actual coil. |
Interestingly, the resonance without the scope probe is 373kHz, which is a period of 2.67u. That's very close to 4 times the propagation delay of the coil (900 turns * pi * 3.5 1n /12in = .824u). So we could calculate Cp=1/(L*(2*pi/(4*Td))^2. Using that method, we get 14pf.
Next, a test primary was wound and its coupling coefficient and self-inductance were measured. The first test used 2 turns of wire for the primary. The coupling coefficient was so low that it couldn't be measured. Next we wound 10 turns near the bottom of the primary and measured a coupling coefficient of 0.225
The
resulting model is shown in Figure 2.

| Figure 2: | The equivalent circuit of the Tesla coil and its primary using SPICE coupled inductors. |
Next, the method of constructing the primary must be considered. The primary needs to use larger wire (smaller AWG) than the secondary. This is because the current is larger in the primary, and the power loss is proportional to the current squared times the resistance. Unfortunately, at higher frequencies, current tends to flow on the outside region of the conductor; this is known as the skin affect.
You can use Intusoft's demo Magnetics Designer software to find the AC resistance of various wire sizes vs. frequency.
Past
the skin depth mentioned above, only 1/e of the total current is found.
For #30 wire at 400kHz, the Ratio of AC to DC resistance is 1.68. The
DC resistance was found to be 85 ohms using a digital multimeter. The
secondary AC resistance is then 1.68 * 85 = 142.
|
Winding the primary: Multiple strands of #30 were used for the primary. This wire is called Litz wire. The idea is to braid each wire strand randomly through the Litz bundle to prevent the magnetic field from moving the current to the outer surface. You can buy Litz wire or make your own. To make your own from #30 wire, you first need to twist several strands together. We used 4 stands for that purpose. Then, take the twisted wire bundles and twist them together to form the Litz wire. We used 3 bundles for a total of 12 conductors. The total DC resistance was measured as .15 ohms, and would be .25 Ohms at 400kHz. To twist the wire, first measure out about 10% more than the length you need. Anchor the four parallel strands on a tripod and connect the other end to an electric drill or lathe. Then, wind about 10-20 turns per foot. Combine the finished bundles, twisting them about 5-10 turns per foot. Wind the Litz wire onto a wire dispenser. Be careful to make sure it doesn't twist. #30 wire is fairly forgiving. It's strong enough to resist breaking and it can be stripped by burning the insulation and sanding the charred insulation with fine sandpaper. You can buy wire with basically 2 kinds of insulation: Formvar or enamel. The Formvar insulation is copper colored. It cannot be soldered. It must be stripped as described, or etched using chemicals, or by scraping the large wires. The enamel insulation, sometimes called solder-eze, is usually colored red or green and can be soldered without stripping; a combination of heat and pressure destroys the insulation. Before winding the primary, you must provide the insulation necessary to prevent arcing. We used 20 mils of polyurethane tape, followed by 0.1in of double stick tape. The double stick tape holds the primary in place while you wind it. The primary must be wound over the bottom of the secondary to minimize the primary-secondary voltage stress. |
The self-inductance of the primary and secondary was measured using an inexpensive LCR meter. The coupling coefficient was calculated by shorting the primary and measuring the secondary inductance. SPICE has built-in models for coupled inductors. It requires the open circuit inductance value for each winding, plus a coupling coefficient that's greater than 0 and less than 1. Simulations were run with the primary shorted, varying k (the coupling coefficient) until the simulation agreed with the measurement. Notice how simulation replaced development of algebraic equations.
Another way of looking at the transformer model is by using a Y network of inductors and an ideal transformer to account for the turn's ratio. That's the model most frequently used in power electronics because of its close relationship to the physical device.
For power electronics, the coupling coefficient is usually so high that the leakage inductors (Le) coupling the energy is small compared to the self-inductance (Lm). When that is true, the Leakage inductors are calculated as (1-K)*Lm. The inductors can be moved through the magnetizing inductance to either side of the transformer, thereby eliminating one of the inductors. Figure 3 below illustrates this paradigm.
 |
|
If
Lm >> (L1 + L2/(N*N)), then the following preserves the
open and short circuit simplification properties
|
 |
| Figure 3 |
However, this is not the case for the Tesla Coil. Figure 4 shows the Y model. Unfortunately the math results in a negative inductance and the physical insight is lost in the mathematics.
Because the coupling coefficient is so low, the primary self-inductance tends to short out the driving signal. However, if a series/parallel set of capacitors is used to couple energy, then the input impedance will increase at resonance, thus achieving decent power transfer efficiency. The LCC configuration shown in Figure 5 was chosen to match the Tesla Coil impedance with the half-bridge power capability. The bridge transistors can switch 14 amps at 400 Volts. If the design is setup to output around 250 watts with a 200 Volt input, then an extra Boost converter can double the voltage and multiply the power by 4.
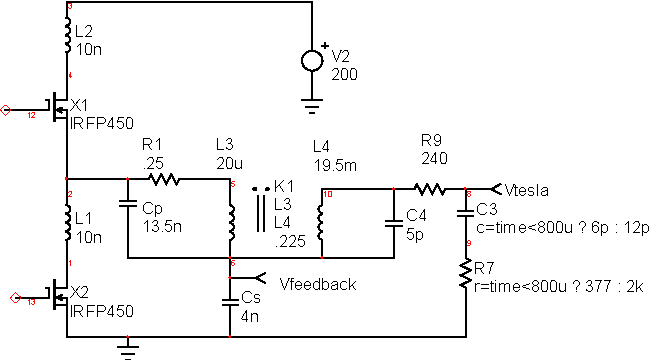 |
| Figure 5: | The complete Tesla Coil Model with the circuitry using Cp and Cs to couple energy from V2 to Vtesla. |
If Cp+Cs is made constant, the smaller values of Cs will reduce the required input current, but increase the voltage. That's how the Tesla Coil is matched to the half bridge capability. When Cs+Cp is reduced, the voltage at Vfeedback will increase and cause greater stress on the capacitors.
If Vtesla is sufficiently large, the air breaks down and plasma streamers will form. The fields near the Tesla Coil can be increased by making geometric discontinuities in the Tesla Coil “antenna.” A pair of pyramid shaped cooking molds were used for this purpose. The plasma will increase the capacitance and add series resistance to the circuit. That affect was simulated by switching the load capacitance and resistance.
Cs and was formed using 10, 10nf polypropylene capacitors: 2 parallel banks of 5 in series. Cp was formed using 15, 22nf polypropylene capacitors: 3 parallel banks of 5 in series. That furnishes a primary RMS current capability of 2.8 amps; that's less than the MOSFET capability, so it will be necessary to limit operational time to avoid over heating.
The MOSFET switches can be made to switch on and off with virtually zero transient stress. This is accomplished by adjusting the current phase with respect to the switching voltage. The tuned circuit needs to operate above its resonant frequency for the LCC configuration used. Table 1 shows the simulation results for several values of capacitance with a 100Vac input.
|
CP
|
kv/amppk@100vdc
|
freq
|
maxvrms
|
operating
point
|
|
6.2n
|
.958
|
373k
|
19k
|
v
= 80, ipk = 20
|
|
8.8n
|
1.79
|
344k
|
35.8k
|
v
= 160, ipk = 20
|
|
13.2n
|
4.16
|
321k
|
72.9k
|
v
= 400, ipk = 17.4
|
|
17.6n
|
7.19
|
313k
|
54k
|
v
= 400, ipk = 7.7
|
| Table 1: | Trading off capacitor values verses stress and performance |
When operating at the proper frequency, the parallel capacitor eliminates inductive spikes when the transistors turn off. Figure 8 illustrates this using the third case in Table 1. The trick is to adjust the resonant current phase such that the voltage will switch to the opposite power rail when the current is turned off. Then, the voltage across the opposite MOSFET will be zero when the other transistor switches ON. These values allow IRFP450 MOSFETS to operate at about 400 VDC input while delivering 1kw. Cs and Cp are selected to stress the capacitor and MOSFETS to their limits at the highest input voltage.
The current in Cp will be (Cp+Cs)/Cs times the current in Cs. These are very high currents and require special capacitors to withstand the stress for continuous operation. Spark-gap driven Tesla Coils operate on a very small duty ratio. If we do the same, for example running the coil for 1ms at 120Hz, the stress can be reduced by 1/8. If polypropylene capacitors are used, a series-parallel bank can be made as shown below in Figure 6 . Another choice is to make one yourself, or using Mica capacitors that are very expensive (we were quoted each $150 for 1nf 3kv 2.4Amp @ 300kHz). Connecting 5 10nf polypropylene capacitors in series results in a 2nf capacitor that can carry 1.2 amps continuous current. That comes to 2.4Amps for the 4nf capacitor. Similarly, the 13nf capacitor is made from series-parallel combinations of 22nf capacitors. The current limit is based on power dissipation, P = I*I*R. If the power is pulsed ON for a duty ratio, D, then the average dissipation is D*P. Therefore we can increase the I*I product by 1/D. To go from 2.4 Amps to 6.5 amps, the I*I ratio is (6.5/2.4)^2 and D= (2.4/6.5)^2 = .136. That results in just over 1ms at 120 Hz rep rate. The final capacitor bank is shown in Figure 6 .
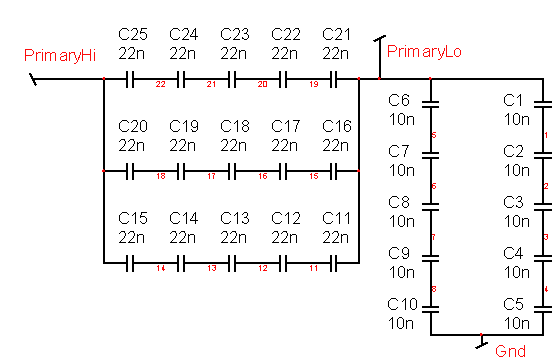
| Figure 6: | Connecting capacitors in series-parallel combination gets the desired current and voltage rating. |
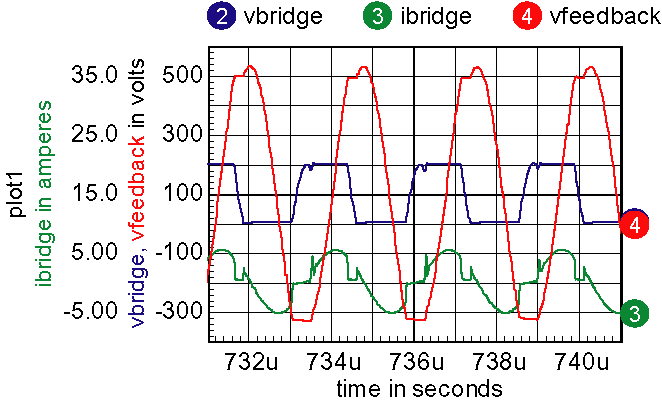
| Figure 7: | This shows the load current and half bridge output when the drive frequency is 363.956kHz, Cs=4n, Cp=13n. | |
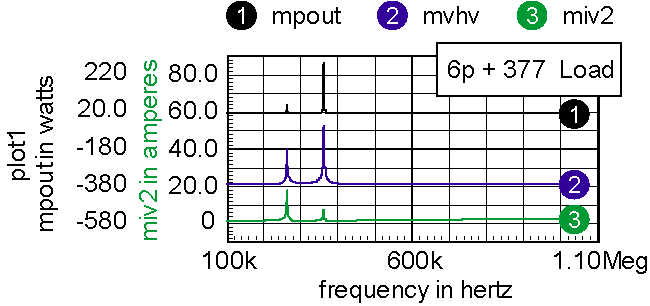
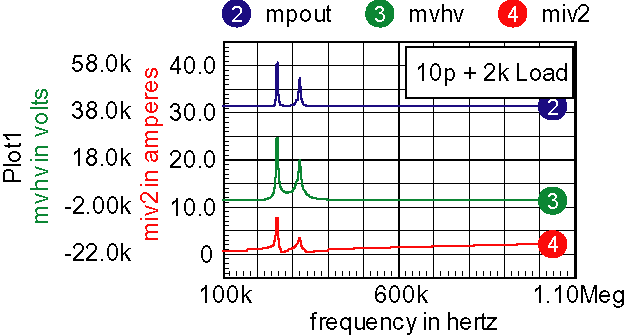
Obtaining the correct feedback for the LCC configuration is more difficult because it requires oscillation past the second resonant frequency. Figure 8 shows the small-signal transfer function of the Tesla Coil.
| Figure 8: | The Tesla Coil exhibits 2 resonant frequencies, the second being preferred. |
| mpout is the magnitude of the power delivered to the load | |
| mvhv is the magnitude of the Tesla Coil output voltage | |
| miv2 is the magnitude of the bridge current |
When the Tesla Coil starts up, the voltage increases until plasma streamers form. These streamers extend the effective area of the load capacitor, increasing its capacitance and at the same time dissipating power. The small signal transfer function is shown in Figure 9 for a simulated plasma discharge.
| Figure 9: | Plasma discharge lowers the second resonant frequency; either frequency produces an acceptable operating point. |
The small-signal transfer function of the half bridge circuit and its driver are shown in Figure 10 . The half bridge driver has a .5usec delay. Part of that delay is used keep both drivers off during switching transitions. It eliminates power shoot-through caused by having both the upper and lower driver turned on at the same time. The delay is simulated using a transmission line to get the transfer function using an AC analysis.
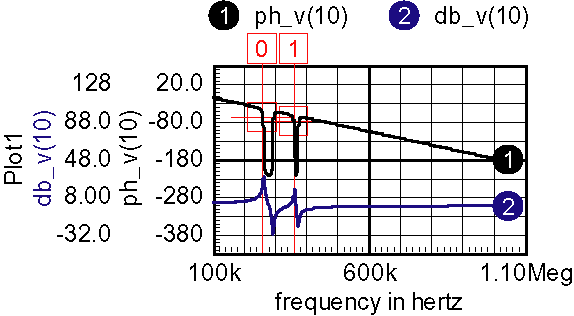
| Figure 10: | Small signal transfer function needs to be shaped for self-oscillation at the second resonant frequency. |
A self-oscillation situation occurs when there is positive feedback at the oscillation frequency, and negative feedback at DC to stabilize the operating point. It turns out that either of the resonant frequencies can be selected by coupling some of the output voltage back into the circuits input. Reversing the feedback polarity selects one of the resonant peaks.
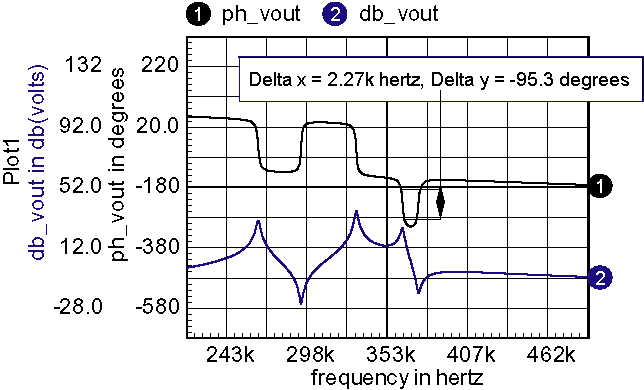
| Figure 11: | The Bode plot shows that the self-oscillation frequency can be adjusted over a 95-degree range by adding phase lead. |
Finally, the compensation is designed using op-amps. The feedback signal is limited using diodes to keep the op-amps within their specified operating region.
| Figure 12: | Compensation for self-oscillation using op-amps |
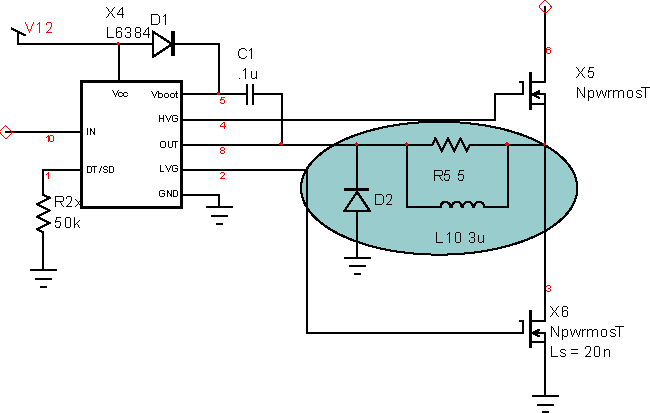
Driving the half-bridge: The resonant current results in a reverse current polarity in the half-bridge transistors of Figure 13 below. The negative voltage increases the driver boost voltage and can damage the driver if negative voltage is lower than -5 volts. This condition is prevented by using a clamping circuit at the driver output. Several windings on a small MPP core yield the desired resistance (core loss provides the resistance). Alternatively, you could use a non-inductive resistor. Teslackt.dwg is the final design. You can re-wire it to connect the sweep generator to the input to see what happens as the drive frequency changes.
| Figure 13: | Half-bridge
driver output needs to be clamped to prevent excessive boost voltage. |
|
Feedback:
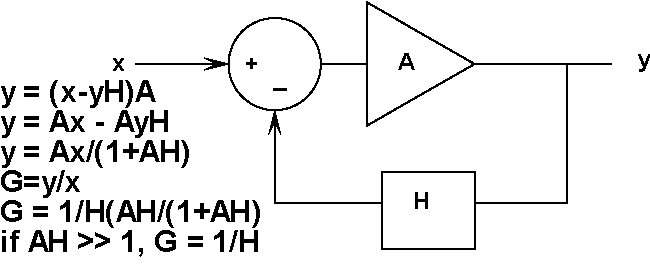
Returning a portion of an output signal back to an input is known
as feedback. Feedback can be either positive or negative. Negative
feedback is used to null an error signal as shown in Figure Feedback
1. If the gain, A, in the forward path is made very large, the
imperfections in the forward path are eliminated and the closed
loop gain becomes 1/H. Unfortunately, the gain of an amplifier
is reduced as the signal frequency is increased. The gain reduction
is accompanied by a time delay. The time delay corresponds to
a different phase lag at each signal frequency. If there is still
some loop gain AH, at a frequency when the phase has shifted 180
degrees, the feedback becomes positive and the circuit breaks
into spontaneous oscillation. Feedback theory use plots of gain
and phase vs. frequency to predict stability as described above.
These plots are known as Bode plots, named after Hendrik W. Bode
who developed the theory at Bell Laboratories in the 1930's.
|
| Figure 14: | Negative feedback tends to eliminate imperfections in the forward gain, A . |
In general, both A and H are made up of networks of resistors, capacitors and inductors. These networks may also contain amplifiers and switches. Feedback theory can also be applied when switches are present by taking the average transfer function (gain) and applying the network.
Both negative and positive feedback are employed in the self-oscillating Tesla Coil. Negative feedback is used to make the driving waveform have a 50% duty cycle for any input voltage. The switching at the drive input is averaged using B1 in control.dwg . The DC signal at op-amp x11, the negative input is balanced by the bridge input from V400 applied to the positive side of op-amp x11.
Both the Tesla Coils resonant circuit and the half-bridge driver delay are included in the transfer function. The IntuScope5 script in control.dwg is run after doing a simulation and opening IntuScope. Then, after opening a new scope window, right click while pointing at the Scope5 script and select “send script” to plot the bode plot and get the magnitude of the high voltage output.
There are 2 schools of thought on how to represent phase in a Bode plot. The sketch in Figure 14 is the “classical control system” way of doing it, with the negative feedback recognized at the summing junction. Instability would then occur when an additional 180 degrees of phase shift is encountered. That's the way it's represented using the Scope5 script in control.dwg. On the other hand, if the amplifier has a negative gain and the summing junction was positive for both quantities, then the phase starts at -180 degrees and instability occurs when it gets back to 0.
Phase shifts extend past 180 degrees for this circuit. Potential instability occurs every 360 degrees. Oscillation will occur for phase shifts of 180+n*360 dgrees for n = 1,2,3… . Reversing the feedback (Figure 12) results in oscillation at the first resonant peek. You can use the transient results to verify the theory.
Working with Off-Line Power Circuits:
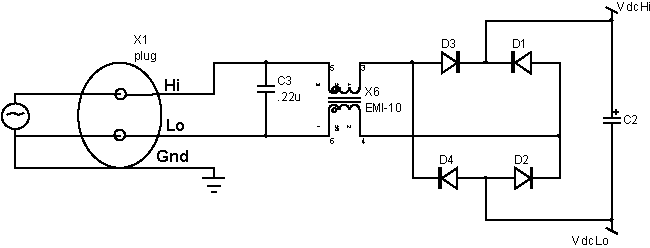
Power supplies are referred to as off-line when they use the rectified power directly from the power mains. That eliminates the need for a bulky 60Hz transformer. Off-line circuits employ a high voltage ground that is usually the negative side of the rectified power as shown in Figure 15 .
| Figure 15: | The high voltage ground must be isolated from bench ground. |
In conventional 3-wire household and industrial applications, one of the power leads is grounded. If you were to connect the high voltage ground to the power mains ground, there would be a short circuit through the bridge rectifier. If that short were through the ground lead of a scope probe, you'd smoke the scope probe! You need to connect bench instrumentation to the high voltage ground for testing, so a floating power source is needed. An inexpensive way of constructing one is show in Figure 16 . Instead of buying a high voltage DC power supply, you use a Variac and isolation transformer to provide floating AC power. Then you can go ahead and ground the output of the bridge rectifier. Adding the halogen lamp in series makes the setup forgiving of accidental short circuits.
| Figure 16: | Floating the AC input allows the high voltage ground to be connected to your bench ground for testing. |
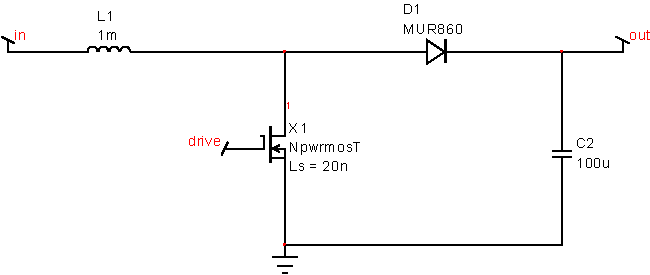
Increasing the voltage: The tesla coil needs up to 400 volts, but the off-line rectifier barely produces 200 volts. To get the increased voltage, a boost regulator is needed as shown in Figure 17 .
| Figure 17: | A simple unregulated boost circuit increases the output. |
The boost converter has the following in-out relationship if the inductor always conducts current.
Vout = Vin/(1-Don).

