 |
|
|
|
|
|
|
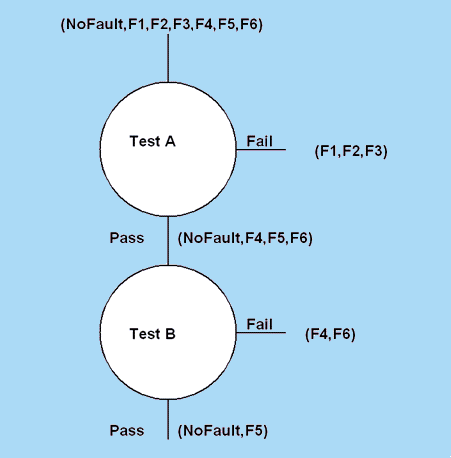
Back in 1996, Intusoft began the development of Test Designer. The final product doesn’t reflect the methods that were discarded. Some of the false starts and mistakes in strategy that we discovered here at Intusoft are showing up in products being proposed even today. The fault tree approach to diagnostics and testing originated when the cost of making a single test was itself expensive. Today, many tests can be made before applying inference logic. It appears, on the surface, that the terminal leaves of a fault tree are simple intersections (see the sidebar for definitions). One could find all such intersections that reach the same conclusion and perform an “Ask the Audience?” type of vote. That method is actually available in Test Designer; however, after discovering the value of a guard band and proper sequencing, it has been virtually abandoned. The problem with such a voting method is that it considers each test to be equal in value. Making a fault dictionary is not exact. Let’s backtrack a bit and define a “Fault Dictionary”. A fault dictionary contains the fault signature for each failure mode or fault. It basically gives the measured response of the unit being tested for each defined fault. The ability to accurately predict these fault signatures is no where nearly as good as our ability to characterize a good unit because the unit under test is placed in a mode that is not as well understood by the test engineer, the design engineer or the simulator. That is, it’s much harder to accurately predict a failed signature that it is to predict the behavior of a good device. If one were to include some uncertainty in the fault dictionary; then the intersections provided in a fault tree would probably contain multiple fault detections even though the fault tree decisions are correct. How can this be? The sequential nature of the fault tree logic prevents you from reaching spurious detections. The sequential nature of the fault tree is NECESSARY; making measurements in parallel isn’t sufficient reason to do the fault logic in parallel. Here is an example showing how an unreliable test becomes more accurate if it’s performed later on in the fault tree logic. |
|
||
|
 |
|
| Figure1 illustrates the importance of a proper test sequence; if test B was perfomed first, there is a high likelihood that failure F1 would be incorrectly diagnosed. When you pick measurements that give solid fault detections, you must make that decision with respect to the faults that are being input to that particular test, not with respect to all faults in the dictionary. It is for this reason that the sequential processing of test intersections using a fault tree gives better fault diagnostics than you get by selecting tests without regard to the guard band or distance between the good signature and the nearest fault signature. |
|
|
Buttons in the Magnetics Designer Transformer and Inductor tabs are fully programmable. Using <Add Buttons> in the <Edit> menu, you can define input data and use equations to calculate output data. The buttons are saved with your design so you can use the equations in other new designs. Here’s an example we did for a customer at PCIM2000 so that he could convert his customers data into the input for the MD spread sheet. He wanted to have power, frequency and duty ratio as inputs for a flyback transformer operating in a discontinuous mode-switching regulator. Here are the button equations we made for him (as shown in Table 1).
Magnetic Designer Button Equations
After entering data shown in the buttons here, press Apply and the results are calculated and displayed in the buttons shown in Table 2. We saved the button template in DCMinductor.mag; which is posted on the web. The actual wave shape for nearly all switching power supplies deviates from the ideal; for example, the triangular current and square voltage in this case. The data MD uses for its calculation is nearly waveform independent. To correct for these differences, you should run a simulation and measure the resulting data and feed these corrected numbers back into MD. One iteration is generally sufficient. Here is what MD does with your inputs: Magnetic Designer Programmable Inductor and Transformer Tabs
The unit polynomials are compressed in the order they are listed in rule.srt. The file, rule.unt is a text file that describes additional units that can appear in the “Trace Properties” dialog (File menu). You can attach units using the dialog to reduce the chance of making a clerical mistake with the set units command. |
||||||||||||||||||||||||||||||||||||||||||||||||||||||
|
|
Note that the discharge time is a free parameter, which was chosen to be the same as the charging time. This works well for offline converters where the breakdown voltage of the switching transistor is of concern; you need to rewrite the button equations if you want to make the discharge time different. We have added our Fair-Rite demo to our web site. This demo was done as a special promotion for Fair-Rite Corporation. It uses a limited set of real cores and limits your transformer or inductor to 2 windings. Our regular demo uses cores that have better performance than you can actually buy; however, you can have as many windings as you like. You can make button equations in both of these demos. This user equation capability can be quite useful for performing a number of repetitive tasks. Notice that you can make your input in a different set of units than your output; for example, use inches for input and centimeters for output. Your input data is not saved, only the spreadsheet entries. |
Units Converter |
|
The Intusoft Units Converter and Calculator Program includes 3 main features: a scientific calculator, a comprehensive engineering units converter with constant storage, and a mathematical/logical expressions evaluation section. Software includes Help and is customizable. The Intusoft unit’s converter acts like a single button in Magnetics Designer. You can combine buttons into a multi-line series of steps. The disadvantage here is that you will have to manually revise certain lines for input. For the discontinuous mode flyback transformer, you can paste the following into the equation field, fill out the question marks and press enter to get L1. Remove one line at a time from the end and press evaluate to get the other parameters. |
power = ???
freq = ???
Vinput = ???
Voutput= ???
DR = ???
Edt = DR*Vinput/freq
Ipeak1 = power/Vinput/DR*2
Ipeak1entry = Ipeak1*1.5
IAC1 =DR*Ipeak1*(4-3*DR/(12*DR))^.5
Iavg1 = power/VinputL1
L1 = Edt/Ipeak1
|
| Scope5
will be released in our next update in late November. In the mean time,
the final Beta is posted on the web. The main addition in this release
is the finalization of the Update function in the <Actions> menu.
You can save a graph as a template for a given analysis. When it’s
recalled and there is an appropriate IsSpice simulation that’s
active, you can press <Ctrl> + u to update the waveforms. You
have 3 choices to define the behavior of the update. First, you can
replace traces on the template plot, secondly you can draw the new traces
on the same plot each with the same scale and thirdly you can make a
new plot for the updated traces. You select the desired operation from
the <Actions> Update menu before pressing <Ctrl> + u. We
have also defined a set of alias waveforms so that you can use the shortcut
w1, w2, … when you type IntuScope script equations. For example,
suppose w1 is current and w2 voltage which already appears on the graph: |
|
power = w1 * w2 plot power newplot plot w1 w2 |
|
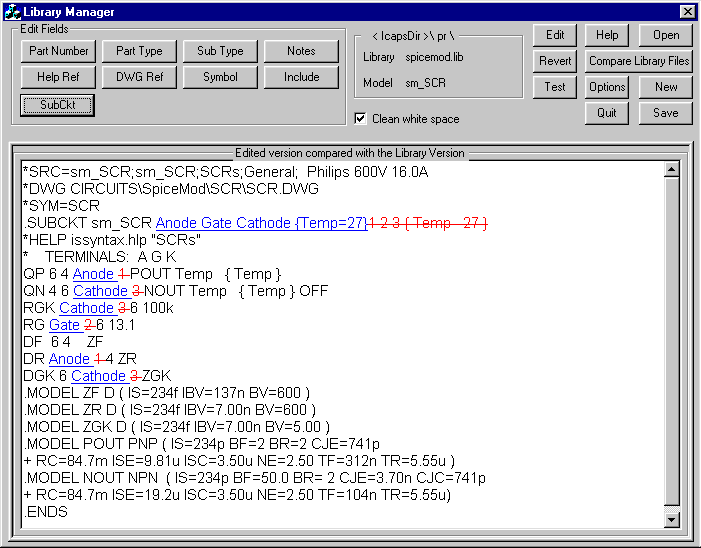
Along with the final release of Scope5, we will have the 8.x.8 update to our ICAP/4 software. This release will serialize (Save) the “vsectol” option and integrate the new library manager test operation. The Library manager when used in conjunction with Spicemod provides the methods needed to easily test and add your own models to your library so that the parts can be placed on the schematic using the Part Browser dialog. Library ManagerIntusoft libraries are saved in ASCII files. You can edit these files with a text editor; however, many of the formats have a fairly rigid syntax. The library manager takes care of reading and applying this syntax so that the ICAP/4 Windows software can read them. Among the features in the Library Manager is the ability to change subcircuit pin names. You can change the pin numbers into meaningful names like “anode,” “gate” and “cathode” as shown in Figure 2. |

|
|
|
|
If the Library Manager is present, pressing edit model in the Part Browser will bring up the library manager instead of IsEd5, the text editor. IsEd5 can sill open and edit libraries using <Ctrl> + d to open a selected file. Common File DialogThe Microsoft common file dialog uses part of the Windows Explorer to display the file name space (Folder, desktop, network layout, etc.). We’ve been waiting for Microsoft to add a recent folder list for a number of years. Symantec added this feature to Apple’s Macintosh computers 7 or 8 years ago. Navigation between various libraries, symbols and test circuitry has become so burdensome, we have gone ahead and made the modification ourselves. You will begin to see a new drop down list at the top of our file dialogs that is titled “Recent”. This will contain our “standard” folder locations along with the most recent places you have visited (at least the ones that are still around). SpiceMod5SpiceMod5, the windows version will also be released with ICAP/4 8.x.8 in late November. It is available for ICAP/4Windows Deluxe, Professional and Test Designer users. It will feature linkage to the library manager along with test circuits and measurement scripts to evaluate each model. Shown here is the revamped SCR tab. Table 3 compares simulation test results with the SpiceMod5 model. Figure 3. shows the test circuit for dvbydt. |
|
Comparison of SpiceMod5 spread sheet entry with its simulated model. |
Parameter
SpiceMod5
Simulation
IDRM( 27DegC) 7u 7.003u IDRM(125DegC) 2.72m 2.709m IRRM( 27DegC) 9.81u 9.812u IRRM(125DegC) .944m .995m dvbydt 50 48.63

|
|
|
| SpiceNet
knows the SpiceMod parameters because SpiceMod makes a file, params.txt
that SpiceNet includes in its netlist, assigning numerical values to
the symbols. Here’s params.txt for this sm_SCR model: The params.txt
file, shown as Table 4, assigns values for SpiceMod5 symbols. |
|
|
|
|
| .param dv_dt=50meg IDRM=0.007m IGT=17.6m IH=74.9m |
| + IRRM=0.00981m ITM=32 ITrms=16.0 Toff=35u |
| + Ton=2u VDRM=600 VGT=0.750 VRGM=5.00 |
| + VRRM=600 VTM=2.00 RGK=100k |
| Scripts were used to get data from
the IsSpice4 Simulator into the SpiceNet schematic database. The script
technology is unique to the Berkeley Spice3 simulators. Many vendors
supply variation of Berkeley Spice3 left this feature out because of
many bugs in the original code. Intusoft has taken the time to make
the scripting language work as was intended to work in Spice3 and has
extended this powerful syntax to perform may more functions; for example,
adding the cursors used in the SCR script. Below, in Table 5, is the
script used to measure dvbydt for the SCR. |
Table 5. dv/dt script constants.error = 100
repeat 10
condition = getcursorY1(vanode)
if condition > 10
gain = 1
else
gain = -1
end
alter @vdvdt[dc] = @vdvdt[dc] + error * gain
constants.error = constants.error / 2
tran 1u 100u
homecursors
end
dvbydt = @vdvdt[dc]
set rewind
echo tran analysis measurements
echo tran analysis measurements
echo
echo test 1 dvbydt
print dvbydt
|
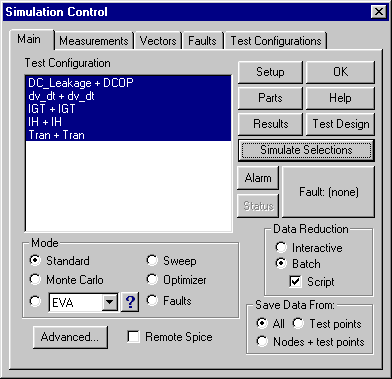
This script gets to the final dvbydt by successive approximation. It increases or decreases dvbydt depending on whether or not the SCR turned on in the previous simulation. The change in dvbydt error is reduced in half each time. The trick in making a test circuit for SpiceMod5 is to insert a model with a common name into Spicemod.lib. Basically we prefix these test models with “sm_”. The SCR model then becomes “sm_SCR”. When SpiceNet is directed to open a drawing with the open_sm action, SpiceNet will prompt you with the “Update Cache” dialog. If you agree, press <Apply> and SpiceNet will load in the new model description. Use the <Actions> ICAPS menu to bring up the simulation control dialog. You can run all of the tests at once by shift selecting all of the “Test Configurations”, Standard Mode, check the script box in data reduction and press <Simulate Selections> as shown in Figure 4. |

Figure 4. The Simulation Control Dialog lets you evaluate your SpiceMod5 model.
|
Then press the <Results> button to compare the simulation results with the Spicemod spreadsheet. A major new feature in SpiceMod5 is the capability to link external DLL’s so that they become model tabs. This is the way the Diac tab was made. We will be releasing the Spicemod Software Development Kit, SMSDK, in November for owners, having up to date maintenance, of ICAP/4 Windows Professional, Power Supply Designer and Test Designer. Anyone that wants to make add-in models for free or for profit can get them listed on our web site if they provide Intusoft with evaluation copies. SpiceMod5 now has a restricted license controlling use of models made using the software. This shouldn’t affect end users, but it prevents our competitors from making and selling models using our software. |
|
|
The geometrical view described by Dauhajre [1] and used in Magnetics Designer yields no leakage inductance for bifilar windings. Bifilar winding reduce leakage inductance significantly; however, using zero may not be good idea. We can instead treat the winding as a transmission line. The common mode inductance is preserved using the IsSpice model for a perfect transformer. The bifilar coupling is then introduced using a transmission line as shown in Figure 5. Determining the impedance of the transmission line
is tricky. As the distance between conductors goes to zero, the impedance
approaches zero. For transformers, the control of the wire separation
is poor so that experimental measurements may be required. Here are
a few values estimated from a graph in the ITT handbook:
Low impedance must go with large diameter wires because the insulation thickness remains constant. Large diameter wires aren’t good at high frequency so we must conclude that an impedance ranging from 10 to 50 ohms is about as good as you’ll get. Here’s the result for a bifilar wound 4-turn #13 winding on a ETD-34 ferrite core. The winding length is 4*2.2/12 ft; if we estimate prop delay of about 1.5nsec to account for dielectric properties and an impedance of 20 Ohms; the following results are obtained:
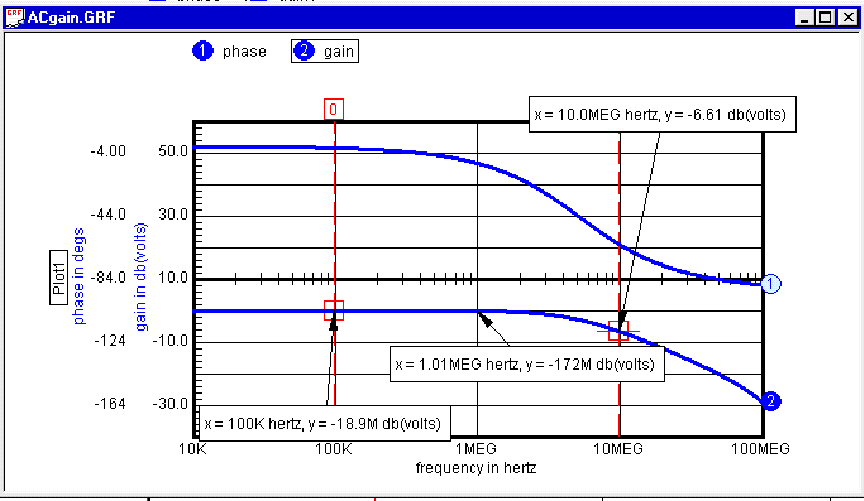
If we load the winding with 1.0 Ohms and input an AC voltage from a .01 Ohm source, the resulting transfer function is shown below. We could further refine (complicate?) the model by using a lossy transmission line; however, we would need to get additional model parameters from experimental measurements. The results show that the transmission line model isn’t required at frequencies commonly used for power supplies (below 1 MegHz). On the other hand, for RF operation, at frequencies above 10MegHz, the transmission line model is needed. The added complexity when using the transformer below 500KHz isn’t really warranted. The transmission line effects at these lower frequencies are small enough to ignore; the external interconnection is likely to be more important than the internal “leakage” inductance. Figure 6 graphs the results. |
 |
|
|
References:[1]Modeling and Estimation of Leakage Phenomena in Magnetic Circuits by Dauhajre, Abrahm Arnold 1986 UMI Dissertation Services. |